Greg Brennan, PG, PHG (greg-brennan@uiowa.edu), Iowa Geological Survey, University of Iowa
Source water assessments are studies that generate information about potential contaminant sources and their possible impact on the local source water quality. The first step in completing a source water assessment is to delineate the land area that contributes water to the drinking water system, and thereby define a mapped area where the pollution potential poses the greatest threat to water quality. For a groundwater system, this delineated area is known as the Well Head Protection Area (WHPA).
Geologic and hydrogeologic factors influence the WHPA delineation. Geologic factors include rock types, like unconsolidated sand and gravel, or sedimentary bedrock units like limestone, dolomite, or sandstone. Hydrogeologic factors include the function of a geologic formation as an aquifer (readily transmits water), semi-confining unit (inhibits the transmission of water), or confining unit (effectively stops the transmission of water), and the parameters that control how water flows through the subsurface, like hydraulic head and hydraulic conductivity, etc.
Subsurface data are collected using various means such as drilling, soils testing, pumping tests, geophysical surveys, and water levels. The data is compiled and used to map the WHPA, often employing a numerical groundwater flow and particle tracking model. The Iowa Geological Survey (IGS) uses the USGS MODFLOW software to determine groundwater flow paths and rates, flow budget, and to accurately delineate the source water area.
Case study: City of Decorah
IGS recently completed a WHPA delineation project for the City of Decorah and this case study provides a great example of how source water delineations are done. For the Decorah project, the IGS conducted research, drilling, monitoring well installation, pumping tests, a geophysical survey, and groundwater flow modeling to improve the previous WHPA delineation. This provided the city with a refined area to focus its planning effort and expenditures on drinking water protection.
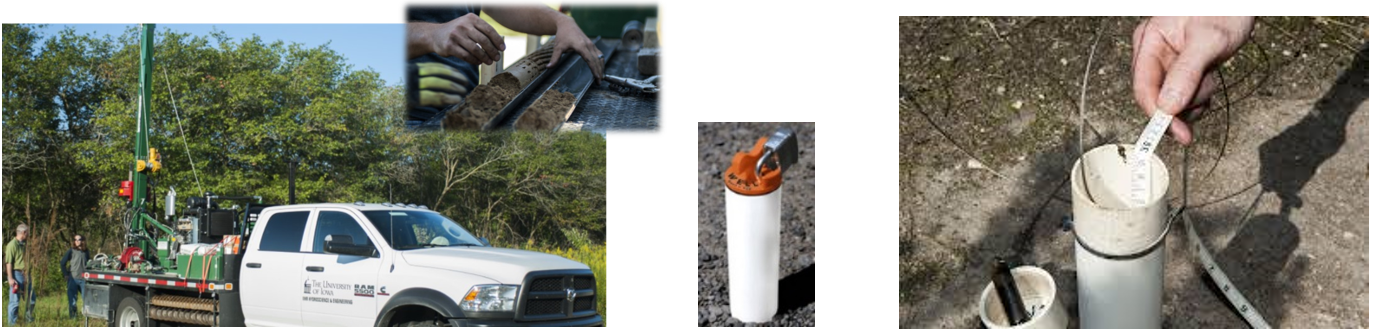
First, drilling and monitoring well installation were completed to provide detailed geologic logs of the subsurface materials and the wells were used for water level measurements (Figure 1).
Second, traditional pumping test analysis and image well methods were employed to determine the mathematical parameters that describe groundwater flow in the aquifer, including hydraulic conductivity, transmissivity, and specific yield. Hydraulic conductivity (permeability) is a measure relating to a geologic material’s ability to transmit water. Transmissivity is a measure relating to flow through the entire saturated thickness of an aquifer. Specific yield relates to the volume of water that will drain from sediments under the influence of gravity, where the volume represents water that can be available for pumping supply via delayed yield.
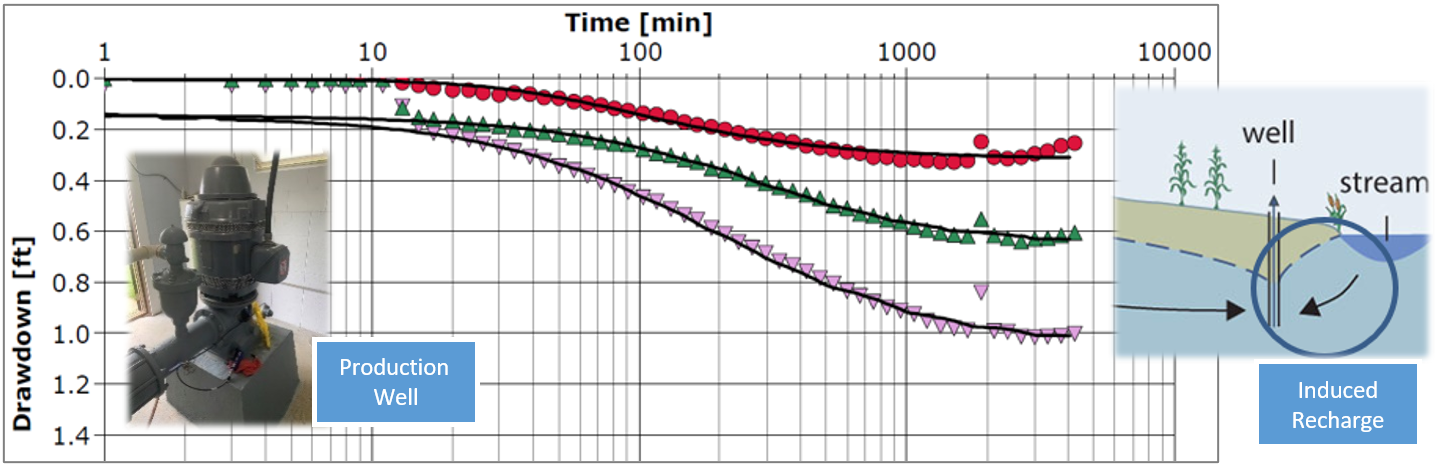
For the 3-day pumping test, Well 2 was operated at a constant discharge rate of 330 gpm and drawdown measurements were collected at available observation wells. Measurements were then graphed for analysis (Figure 2). The analysis indicated the presence of a hydrogeologic boundary. A boundary is suspected when there is either more, or less, groundwater flow converging on a production well than would otherwise be predicted by its calculated aquifer parameters. A recharge boundary was indicated in this case because drawdown begins to stabilize (curves flatten) during the late-time testing, and because an image well was needed to match the curves. The method of image wells is a technique for incorporating the effect of boundaries into the drawdown calculations.
When a water feature, such as the Upper Iowa River, is hydraulically connected to an aquifer it can form a recharge boundary. When a water well is pumping near a recharge boundary it can locally reverse the hydraulic gradient and induce leakage from the river into the aquifer where it then flows to the pumping well. Knowledge of this groundwater/surface water interconnection informs the development of the groundwater flow model and ultimately the delineation of the WHPA.
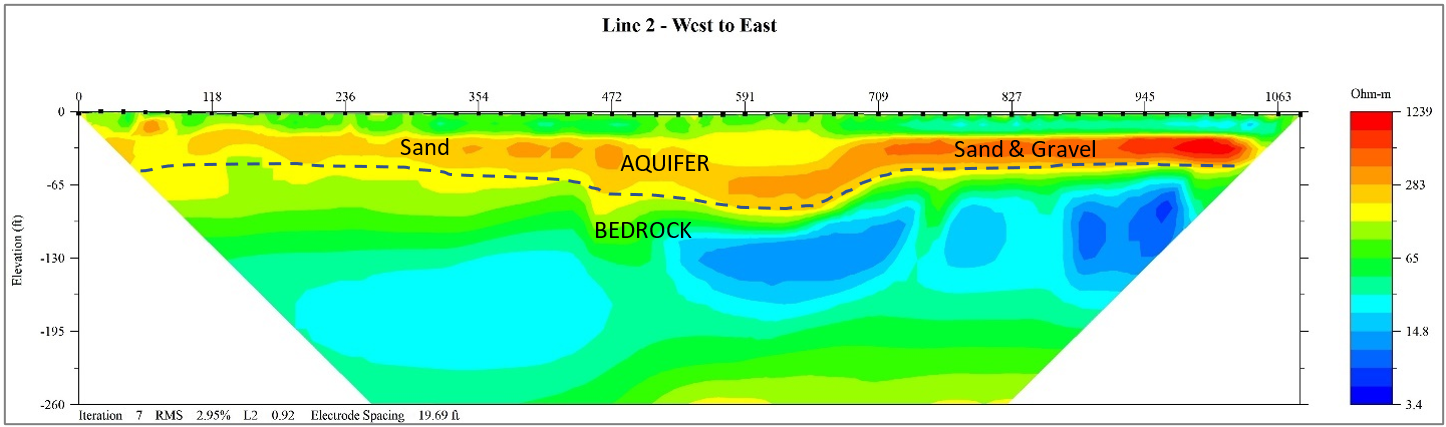
Third, the numerical modeling requires generation of surfaces, including the ground surface and top of bedrock which were used to define a two-layer model. To generate the surfaces the IGS database Geosam was queried to identify well logs that establish depth to bedrock and the geology. A geophysical survey was employed to further resolve the geology in the vicinity of the city’s wells. The electrical imaging specifically helped define depth to bedrock and the lateral variation in permeable aquifer materials in areas between the wells and along the river that do no not have well logs (Figure 3).
The model software Visual MODFLOW Flex Pro, Ver. 8.0 (Waterloo Hydrogeologic, 2022) was used to simulate groundwater flow and derive the WHPA capture zone. Model tools utilized included parameter estimation for model calibration, particle tracking, and Zone Budget to track water balance changes.
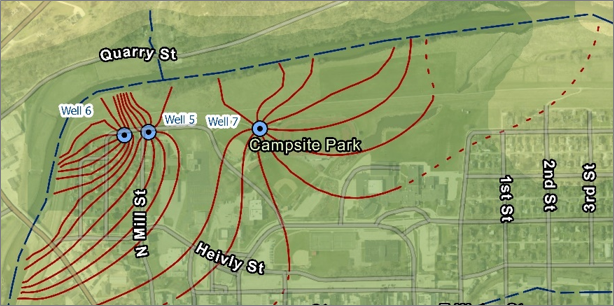
Capture zones for each well were delineated using particle tracking in the model. A group of ten hypothetical particles were placed to encircle each pumping well and the particles were reverse-tracked to their source origin (Figure 4). The pattern of tracks defined the capture zone for each well, and then multiple wells were merged to define the capture zone for a well field. Zone Budget was used to estimate the exchange of groundwater/surface water, which in this case an estimate of river water moving into (recharging) the aquifer. The capture zones and Zone Budget analyses indicated that 13 percent of the water pumped in the North Well Field (under simulated conditions) was derived from induced recharge from the river, and 87 percent was derived from groundwater stored in the aquifer.
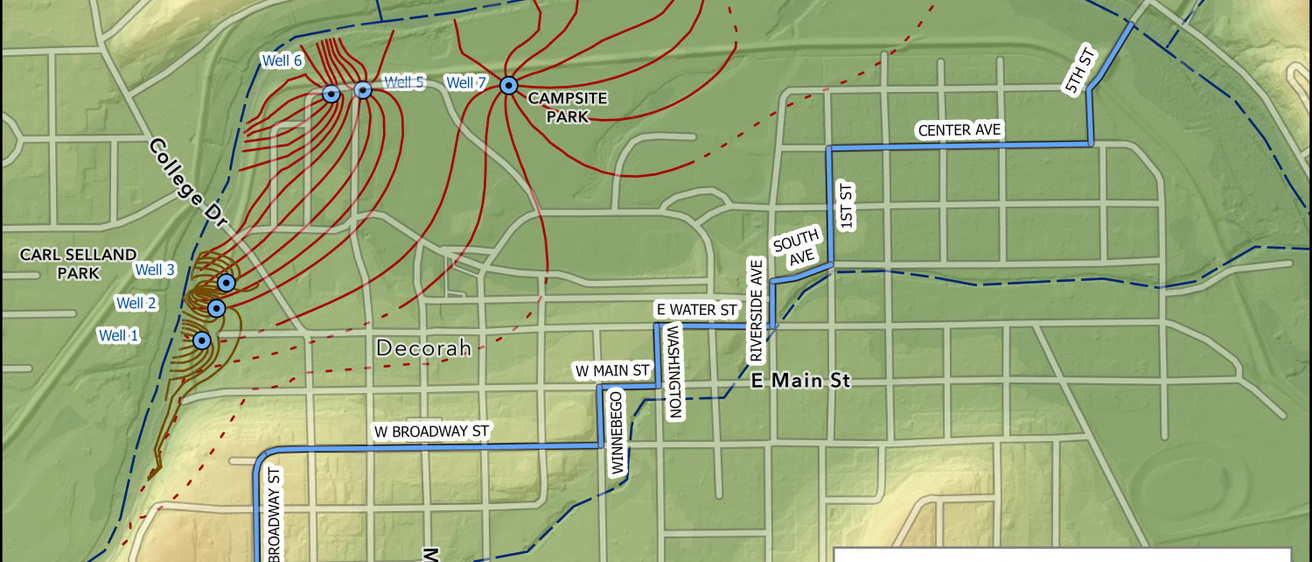
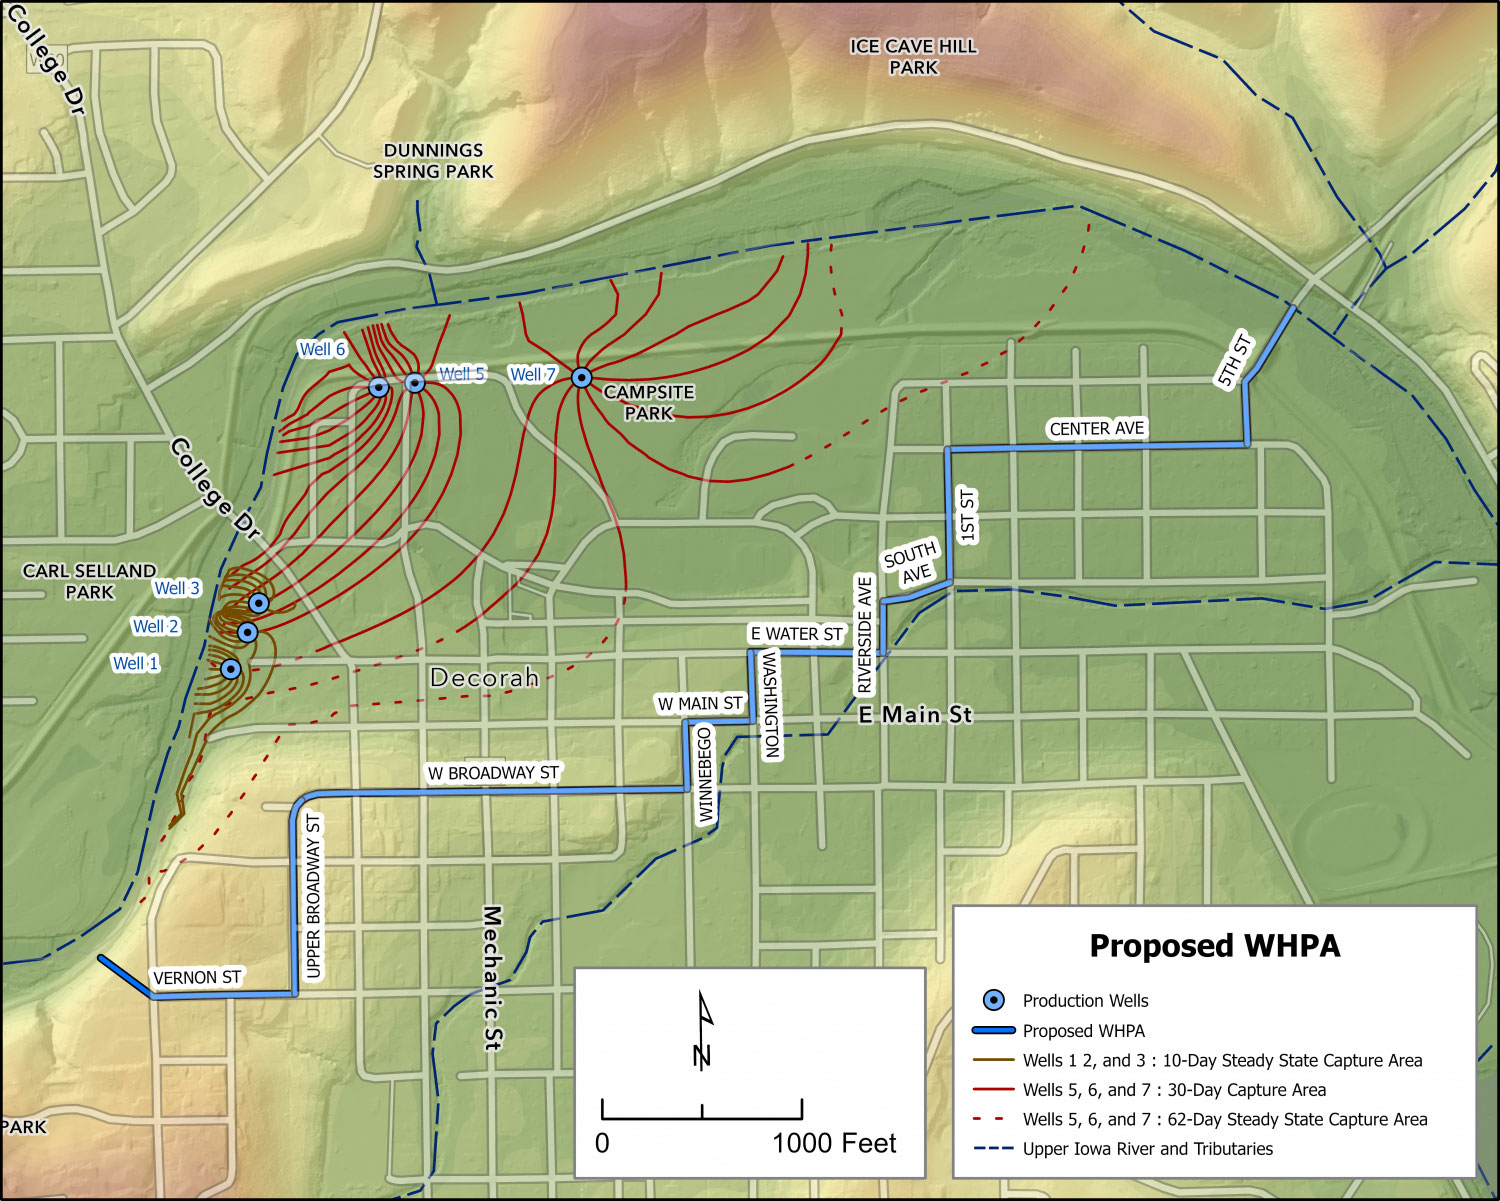
The recommended WHPA was based on the flow model’s predicted capture zone results. The WHPA was drawn to encompass both the groundwater capture zones and ground surface elevation features that contribute surface water runoff to the capture area. IGS typically recommends the WHPA delineation be simplified by using real-world features such as streets to represent the WHPA (Figure 5). This facilitates contaminant source inventories and is an aid to land use planning decisions. An area so defined can easily be written into local zoning or ordinances and the WHPA marked by beneficial signage, all of which provide concrete visuals to raise community awareness of the vulnerable source water area.
Source water assessments for communities
As the example for the City of Decorah demonstrates, getting the WHPA boundaries defined correctly better ensures that a Source Water Plan can be implemented in the most effective and reasonable manner possible. Without WHPA boundaries defined by a project such as the one shown for Decorah, a community may err on the side of creating a much larger zone than is needed in the interest of being “safe”. However, a zone that is overly large will include areas that are not contributing areas and may make implementation protection plans more difficult. Similarly, an area too small or narrowly focused may miss potential contaminant sources and pathways.
For better and more accurate source water delineations, IGS is available to assist communities with their well head protection planning, especially in the crucial delineation of the well head protection area.