Photo by Doreen Van Ryswyk/USFWS
A New Model
IGS researchers are developing a better understanding of the time required for groundwater to move in agricultural watersheds, as well as the lag time needed for groundwater to respond to
land use change.
IGS worked closely with Iowa Department of Natural Resources (IDNR) GIS specialists to develop a groundwater travel time model to evaluate groundwater travel times in a southern Iowa watershed and in a tile-drained basin in central Iowa.
Projects
Walnut Creek Watershed
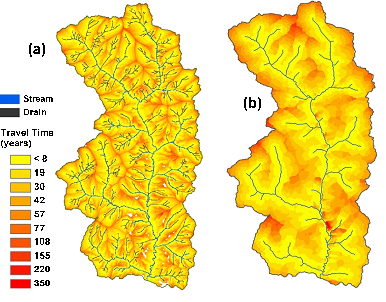
At the Walnut Creek watershed in Jasper County, IGS hydrogeologists estimated the groundwater travel time in the basin to be approximately 10 years and found general agreement among different methods.
(See left) Spatial distributions of travel times obtained from (a) MODFLOW and (b) GIS. Note the difference in drainage network used in MODFLOW and GIS approaches.
Bear Creek Watershed
Sponsor: National Science Foundation
Location: Bear Creek Watershed in north central Iowa
Personnel: Keith Schilling
Goals: To quantify the effects of artificial subsurface drainage on groundwater travel times
Date: 2014–2015
Outcomes:
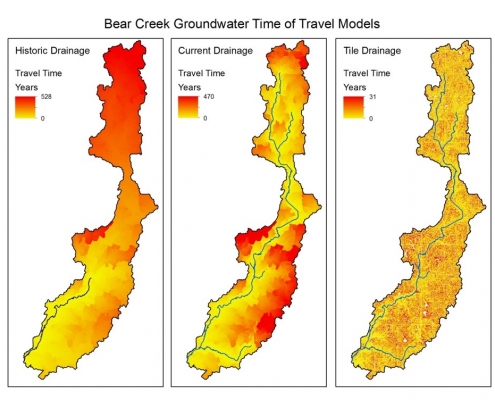
- Researchers quantified how groundwater travel times are changed by tile drainage.
- (See figure) Spatial distribution of travel times in Bear Creek watershed considering three different drainage configurations.
Neal Smith National Wildlife Refuge
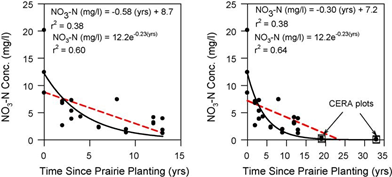
IGS is investigating the time it takes for groundwater to respond to land use changes at the Neal Smith National Wildlife Refuge in Jasper County, Iowa.
At the refuge, native prairie is replacing row crops, and IGS researchers are monitoring conditions during the restoration process.
Results are showing that land use change from crop to grass reduced groundwater nitrate concentrations by approximately 0.5 to 1 mg/l per year following restoration.
(See illustration below) Comparison of trend lines fitted through chronosequence plots with a linear and exponential model. Left: NSNWR chronosequence plot data. Right: NSNWR data and chronosequence plots from CERA plots near Grinnell, Iowa (see text for details). P < 0.05 for all regression models.
Additional Information/Publications
Schilling, K.E., C.F. Wolter, T.M Isenhart, and R.C. Schultz. 2015. Tile drainage reduces groundwater travel times and compromises riparian buffer effectiveness. Journal of Environmental Quality, 44:1754-1763.
Schilling, K.E. and P. Jacobson. 2009. Groundwater conditions under a reconstructed prairie chronosequence. Agriculture, Ecosystems & Environment 135:81-89.